

Calculating your product's carbon footprint is a solid starting point for any climate strategy.
But what about the other environmental pressures created throughout your product's lifecycle? A narrow focus on carbon emissions can overlook significant impacts, such as your water footprint or land use footprint, leaving them completely out of sight.
To make truly informed sustainability decisions, you need a complete picture.
That's why, by request, Arbor's platform now includes additional indicators of environmental impact. This feature enables you to view a multi-dimensional representation of your product's footprint, helping you identify hidden risks and opportunities for improvement that extend far beyond carbon emissions.
Why it matters: A multi-dimensional view of sustainability
Measuring carbon is fundamental, but other key sustainability metrics include water consumption and land use. This is especially true in resource-intensive sectors, such as agriculture, textiles, and electronics.
Tracking these flows reveals where your operations might be pressuring freshwater reserves or converting ecosystems, insights that carbon data alone cannot provide.
A holistic view prevents "problem shifting," where solving one issue (such as carbon) inadvertently makes another worse (like water scarcity).
The hidden story in your supply chain
Consider these real-world examples where looking beyond carbon tells a more complete story:
- Leather Goods: A leather wallet may have a carbon footprint similar to that of a high-quality synthetic alternative. However, leather production has a significant land use footprint, driven by cattle grazing and the cultivation of feed crops. This can contribute to deforestation and biodiversity loss. Without analyzing land use data, these critical environmental risks remain hidden.
- Aluminum Components: In manufacturing, using recycled aluminum yields a lower carbon footprint compared to using primary aluminum. But what if the recycling facility is located in a water-scarce region and uses large amounts of water for cooling and processing? The carbon-only view would show a "low impact" choice, while the data on its water footprint would reveal a major operational risk.
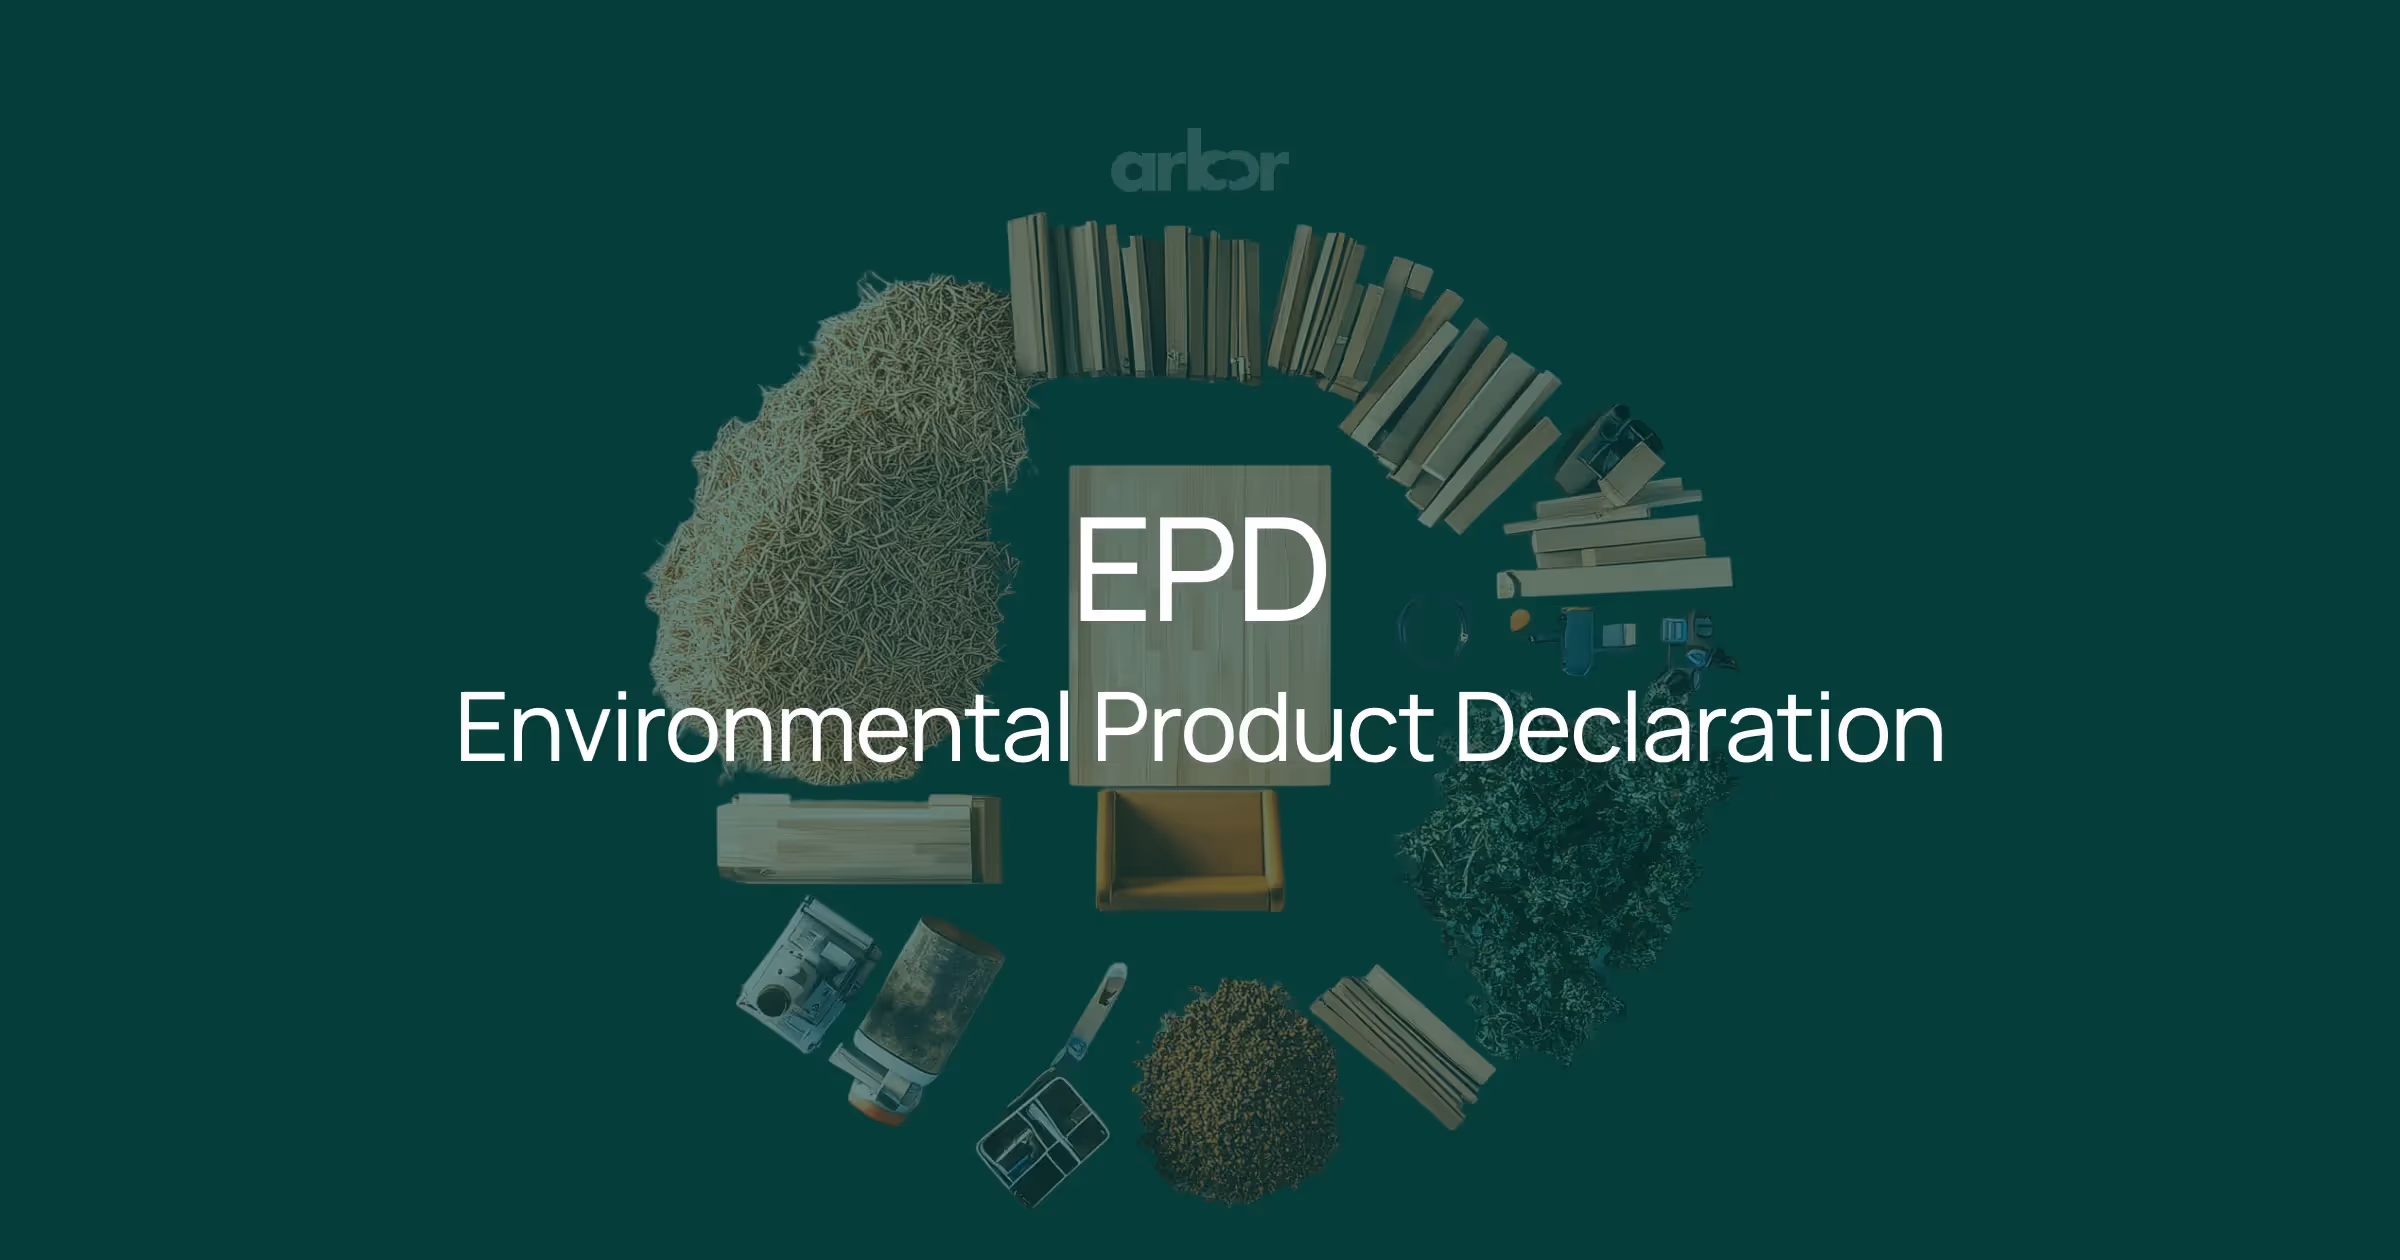
Understanding your total impact helps you build a more resilient and genuinely sustainable business. It provides the data necessary to respond to investor questions, meet customer demands for transparency, and comply with comprehensive disclosure requirements, such as Environmental Product Declarations (EPDs).
How it works on Arbor's platform
Integrating these new environmental impact indicators into your analysis is a seamless process on Arbor’s platform.
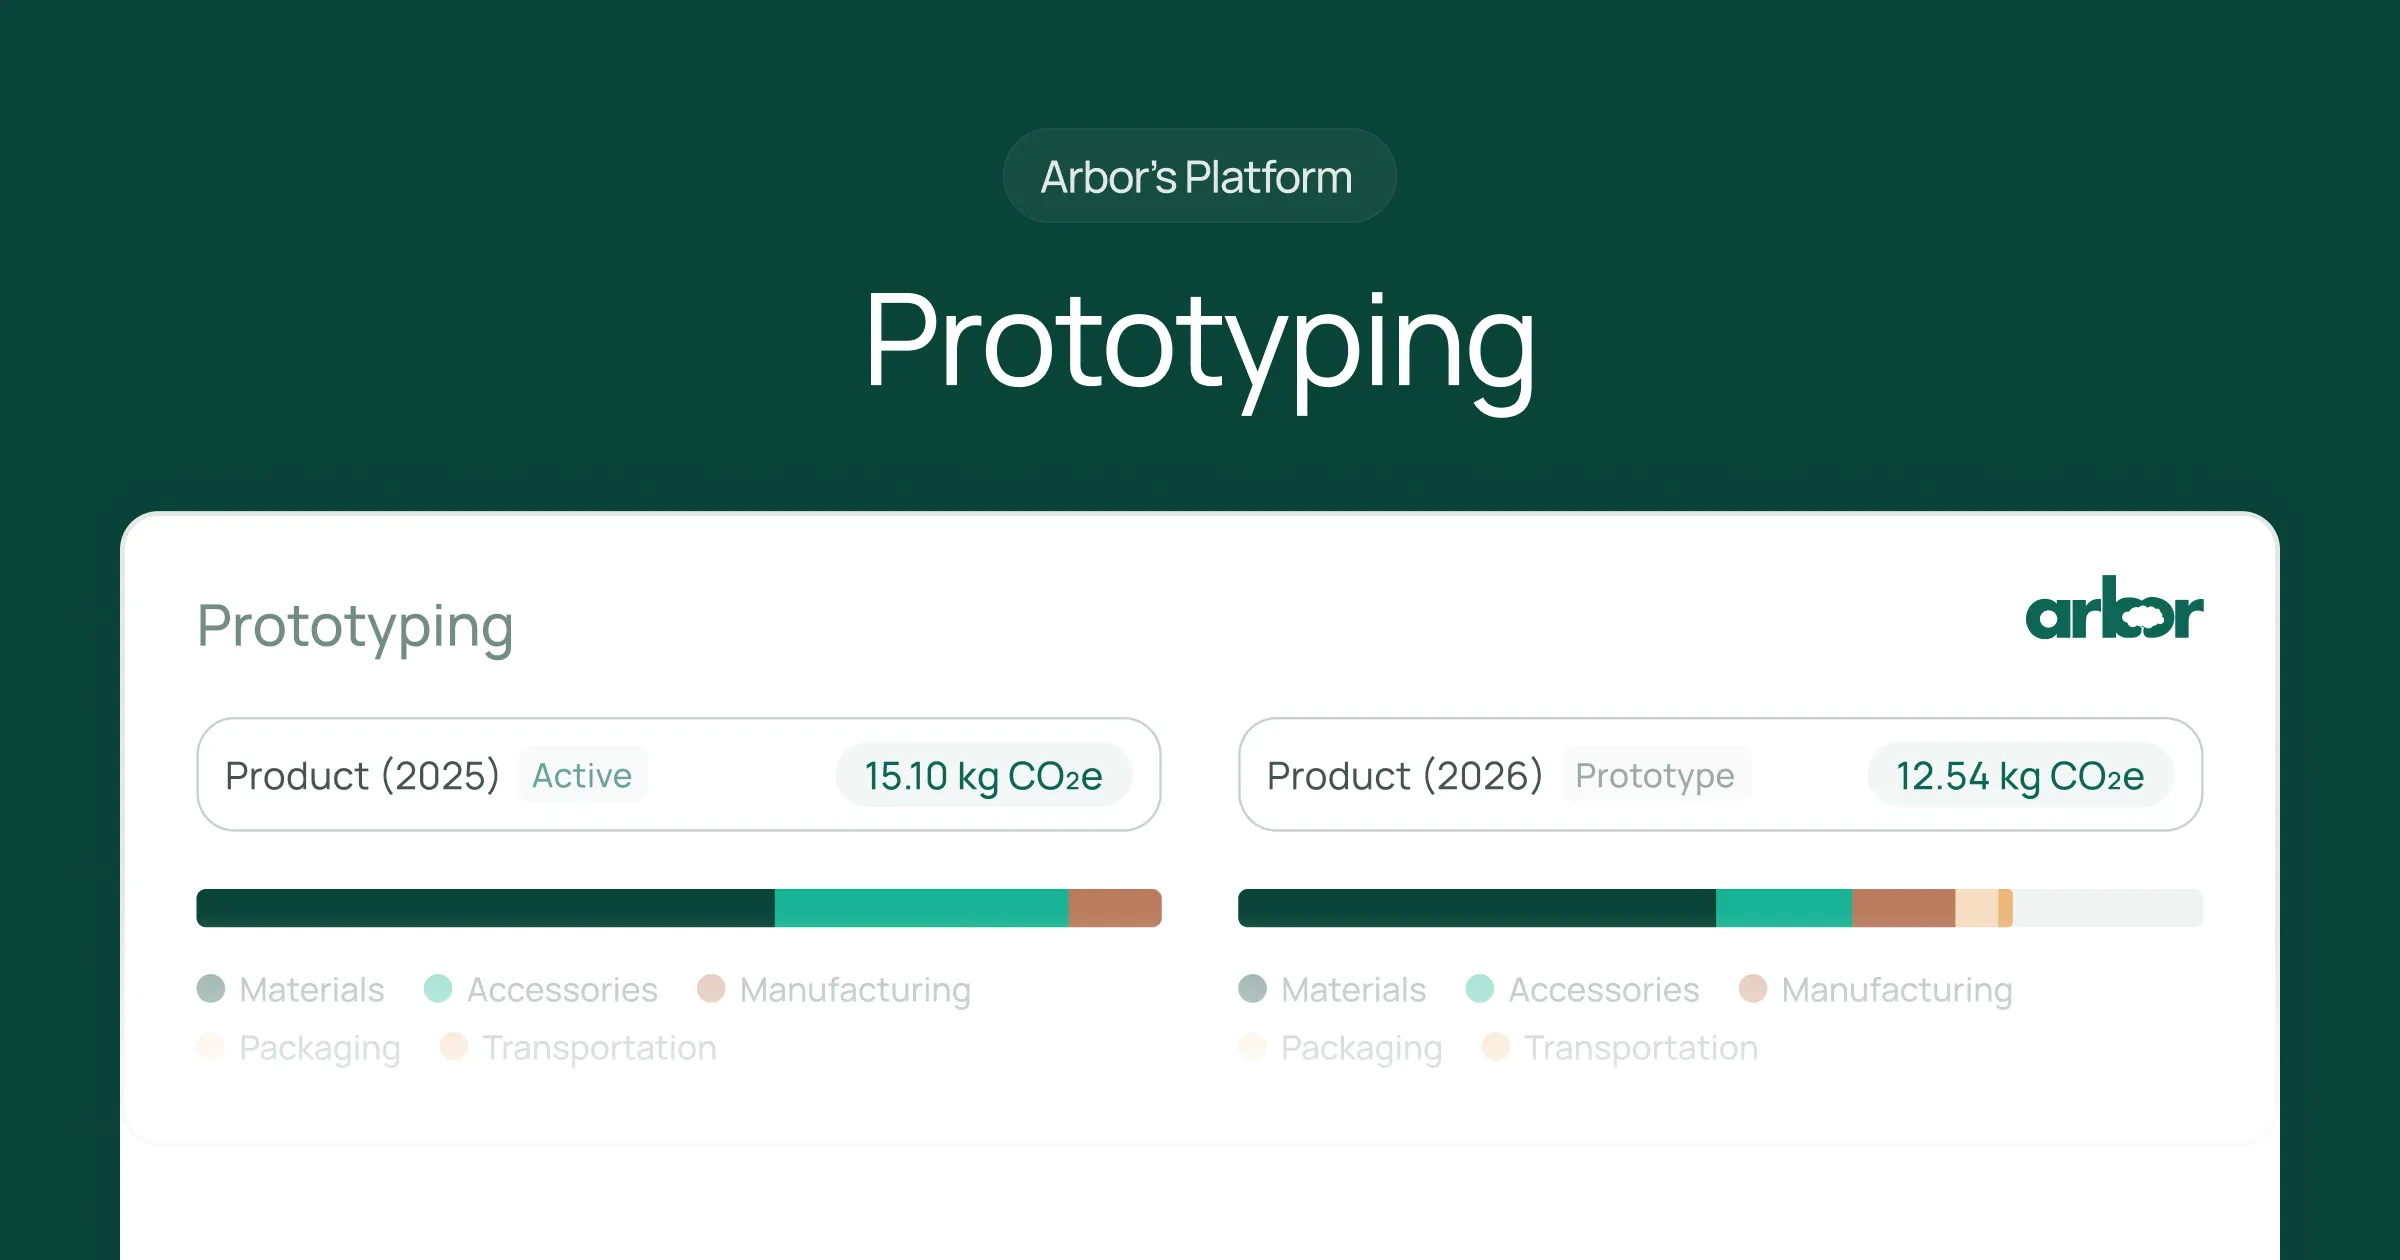
1. Measure your product footprint
You start by modelling your product's lifecycle in the platform as you normally would to get your carbon footprint. This involves inputting data on materials, manufacturing processes, transportation, and more. This same model serves as the foundation for any subsequent analysis.
2. Request a deeper analysis
Once your carbon footprint is complete, you can request any additional impact indicators from our team. We can then calculate your product's water footprint, land-use footprint, or any other impact indicators you require.
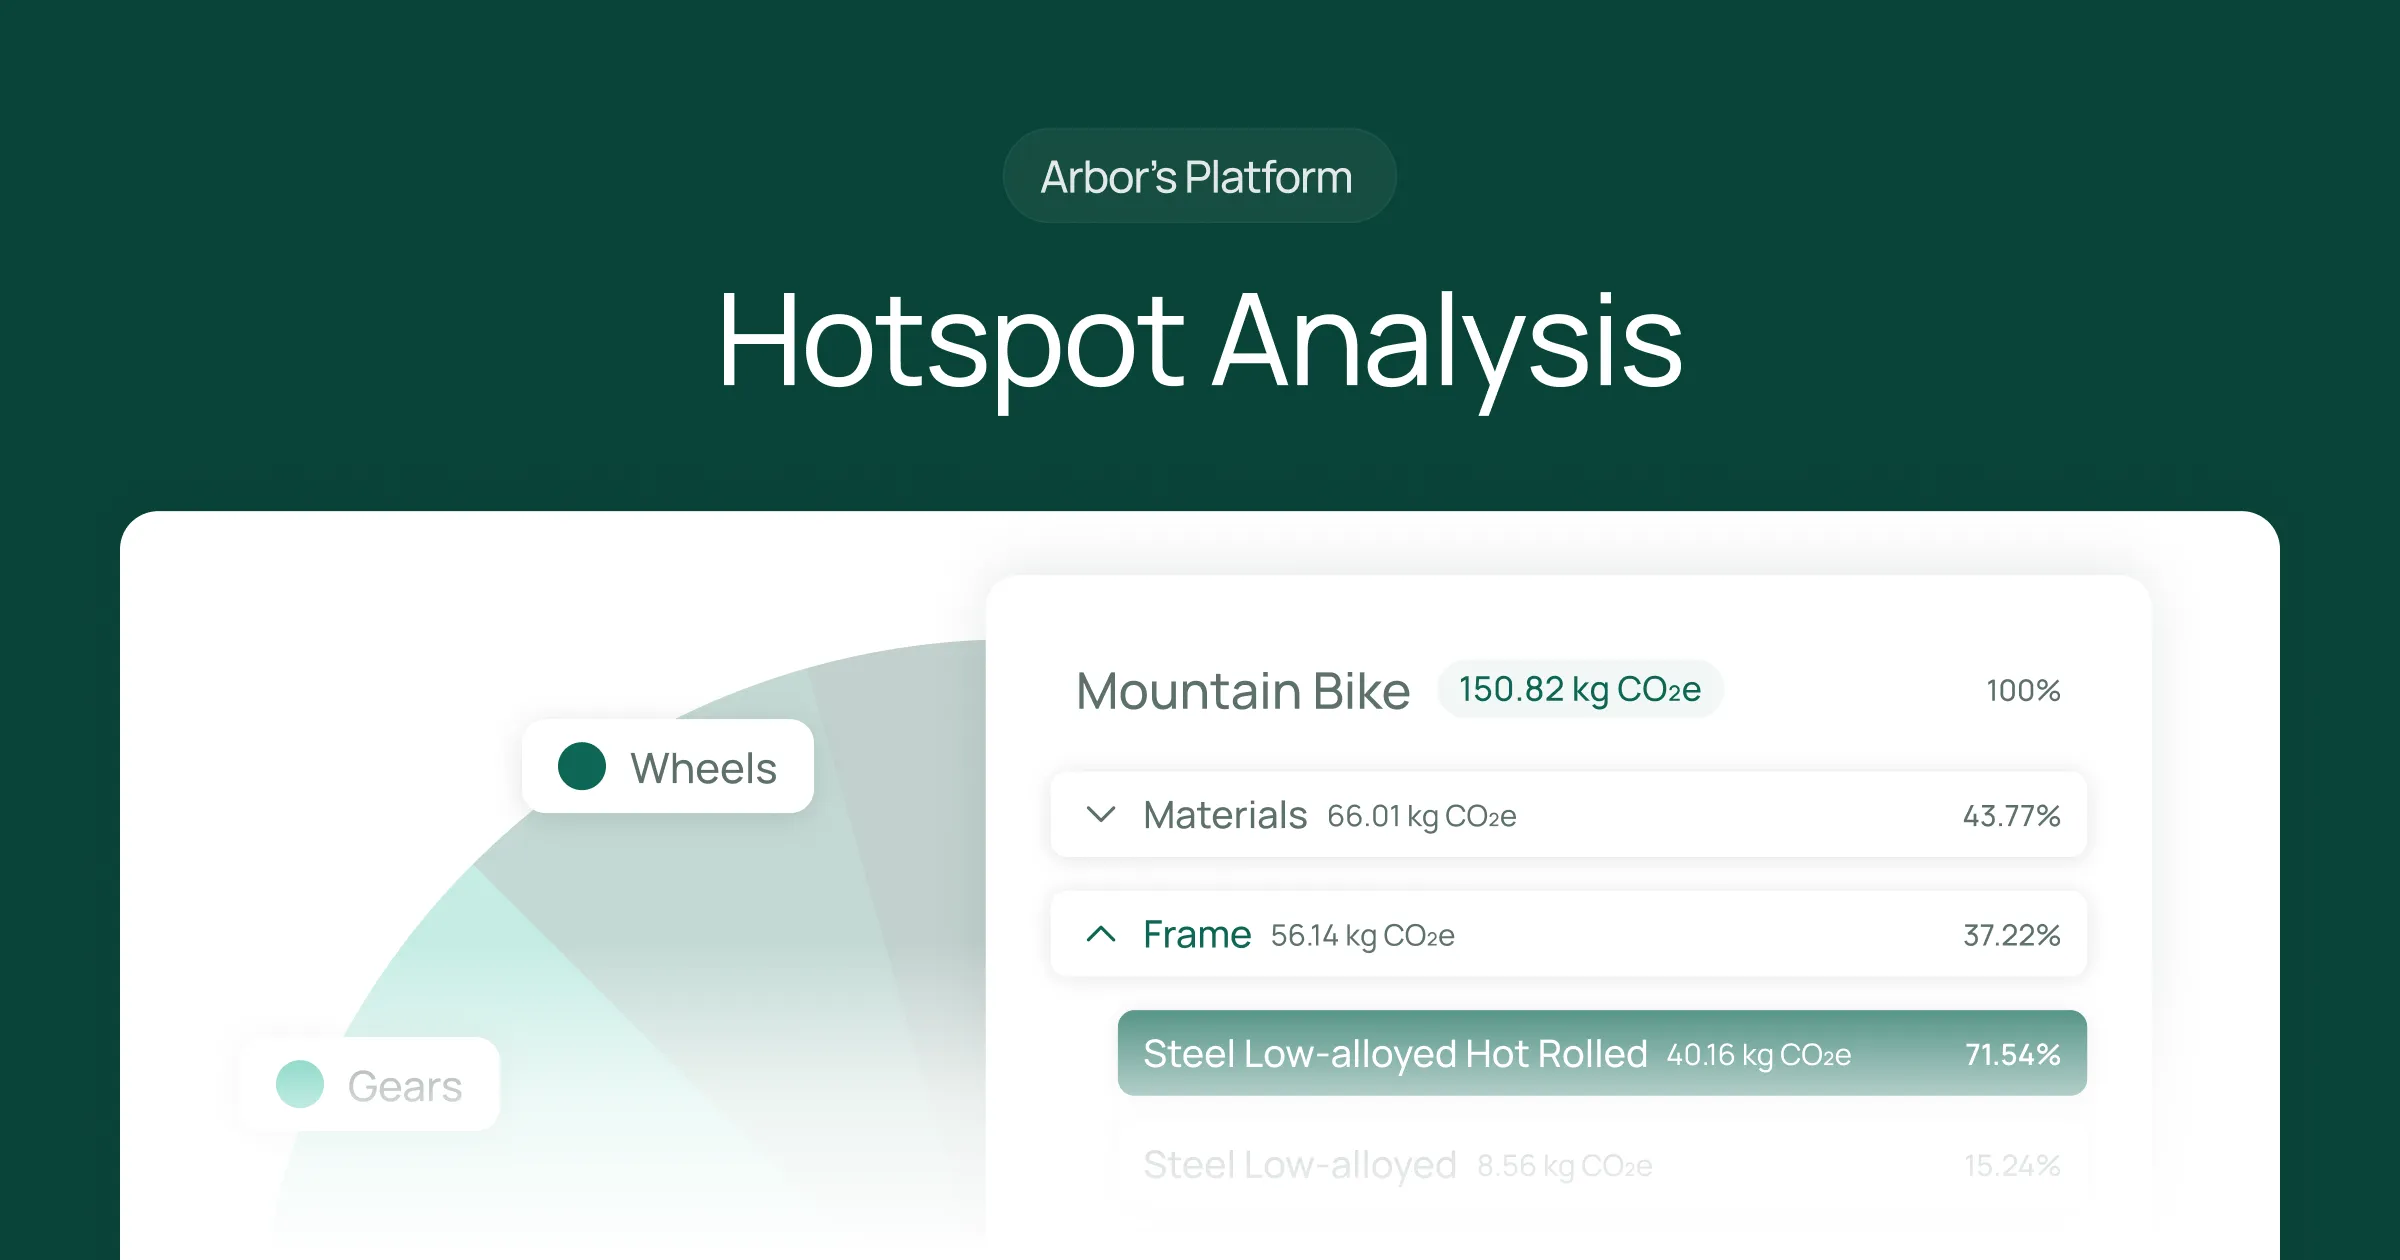
3. Interact and drill down for detail using hotspot analysis
With your expanded results, you can use Arbor's hotspot analysis feature to explore the data. This tool enables you to navigate through visual representations of your product's impact, allowing you to drill down into lower tiers of your supply chain. You can pinpoint exactly which supplier, process, or material is driving the most water consumption or land occupation, giving you clear targets for reduction efforts.
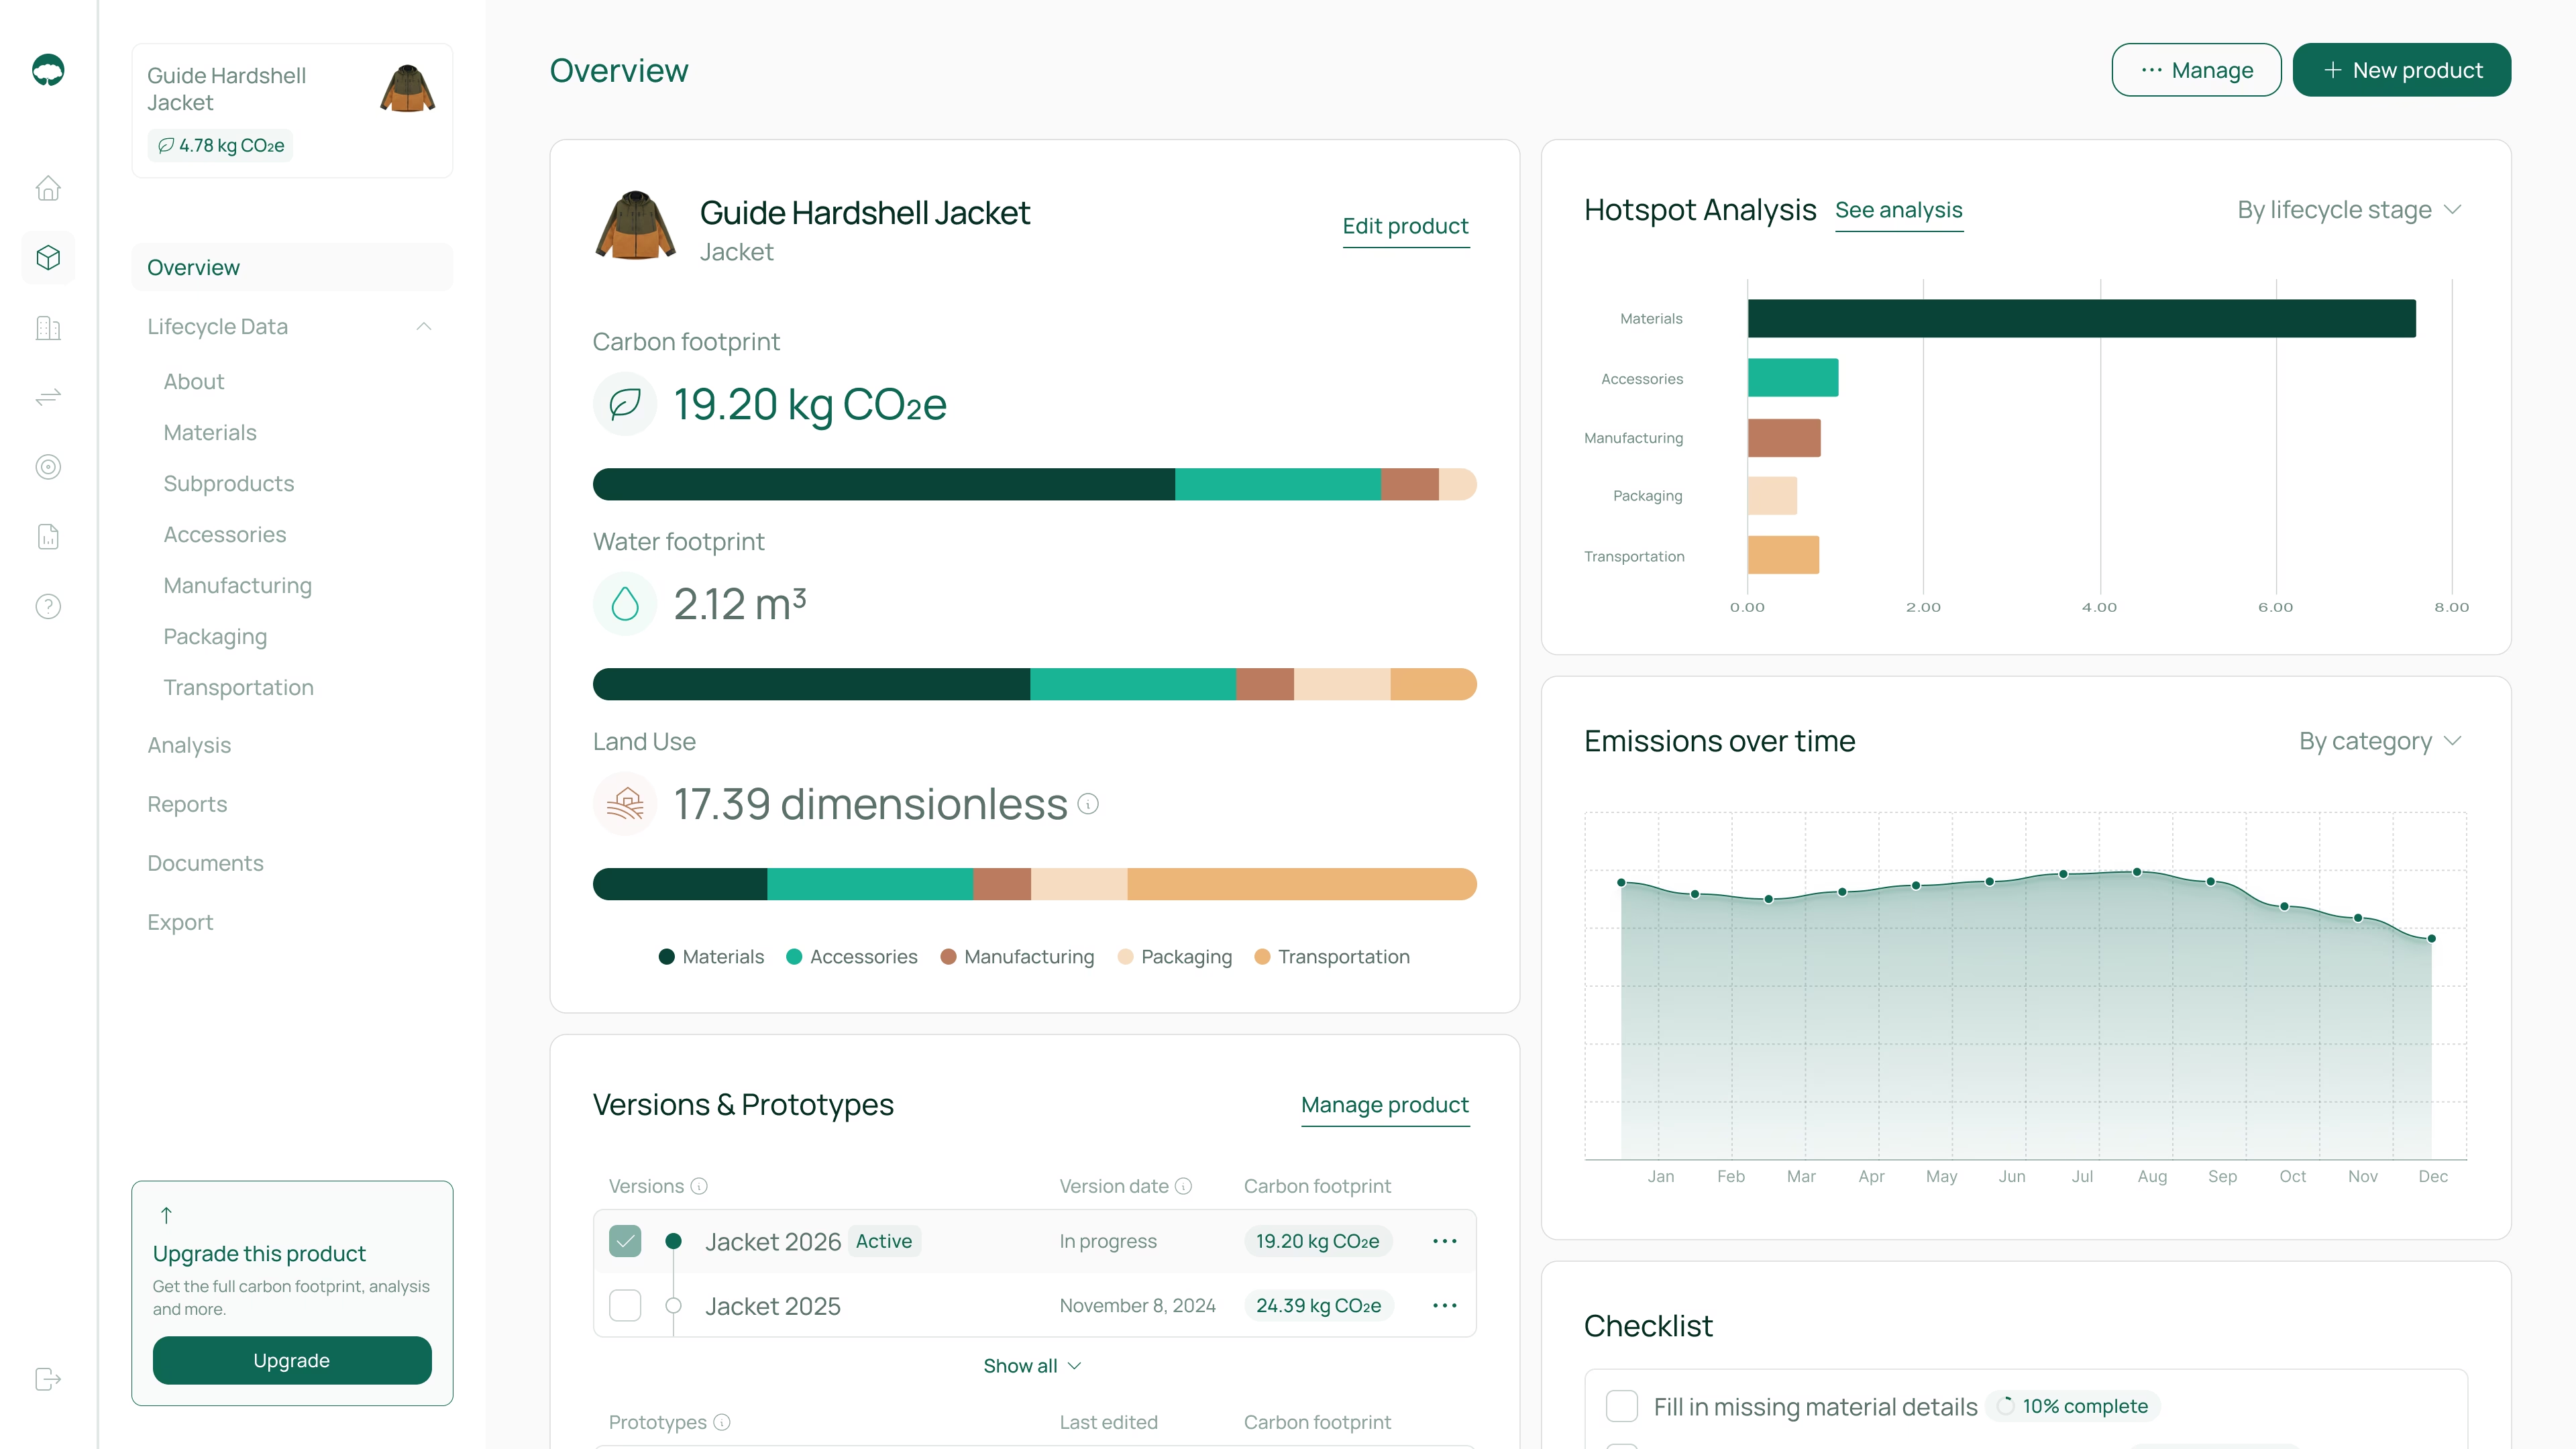
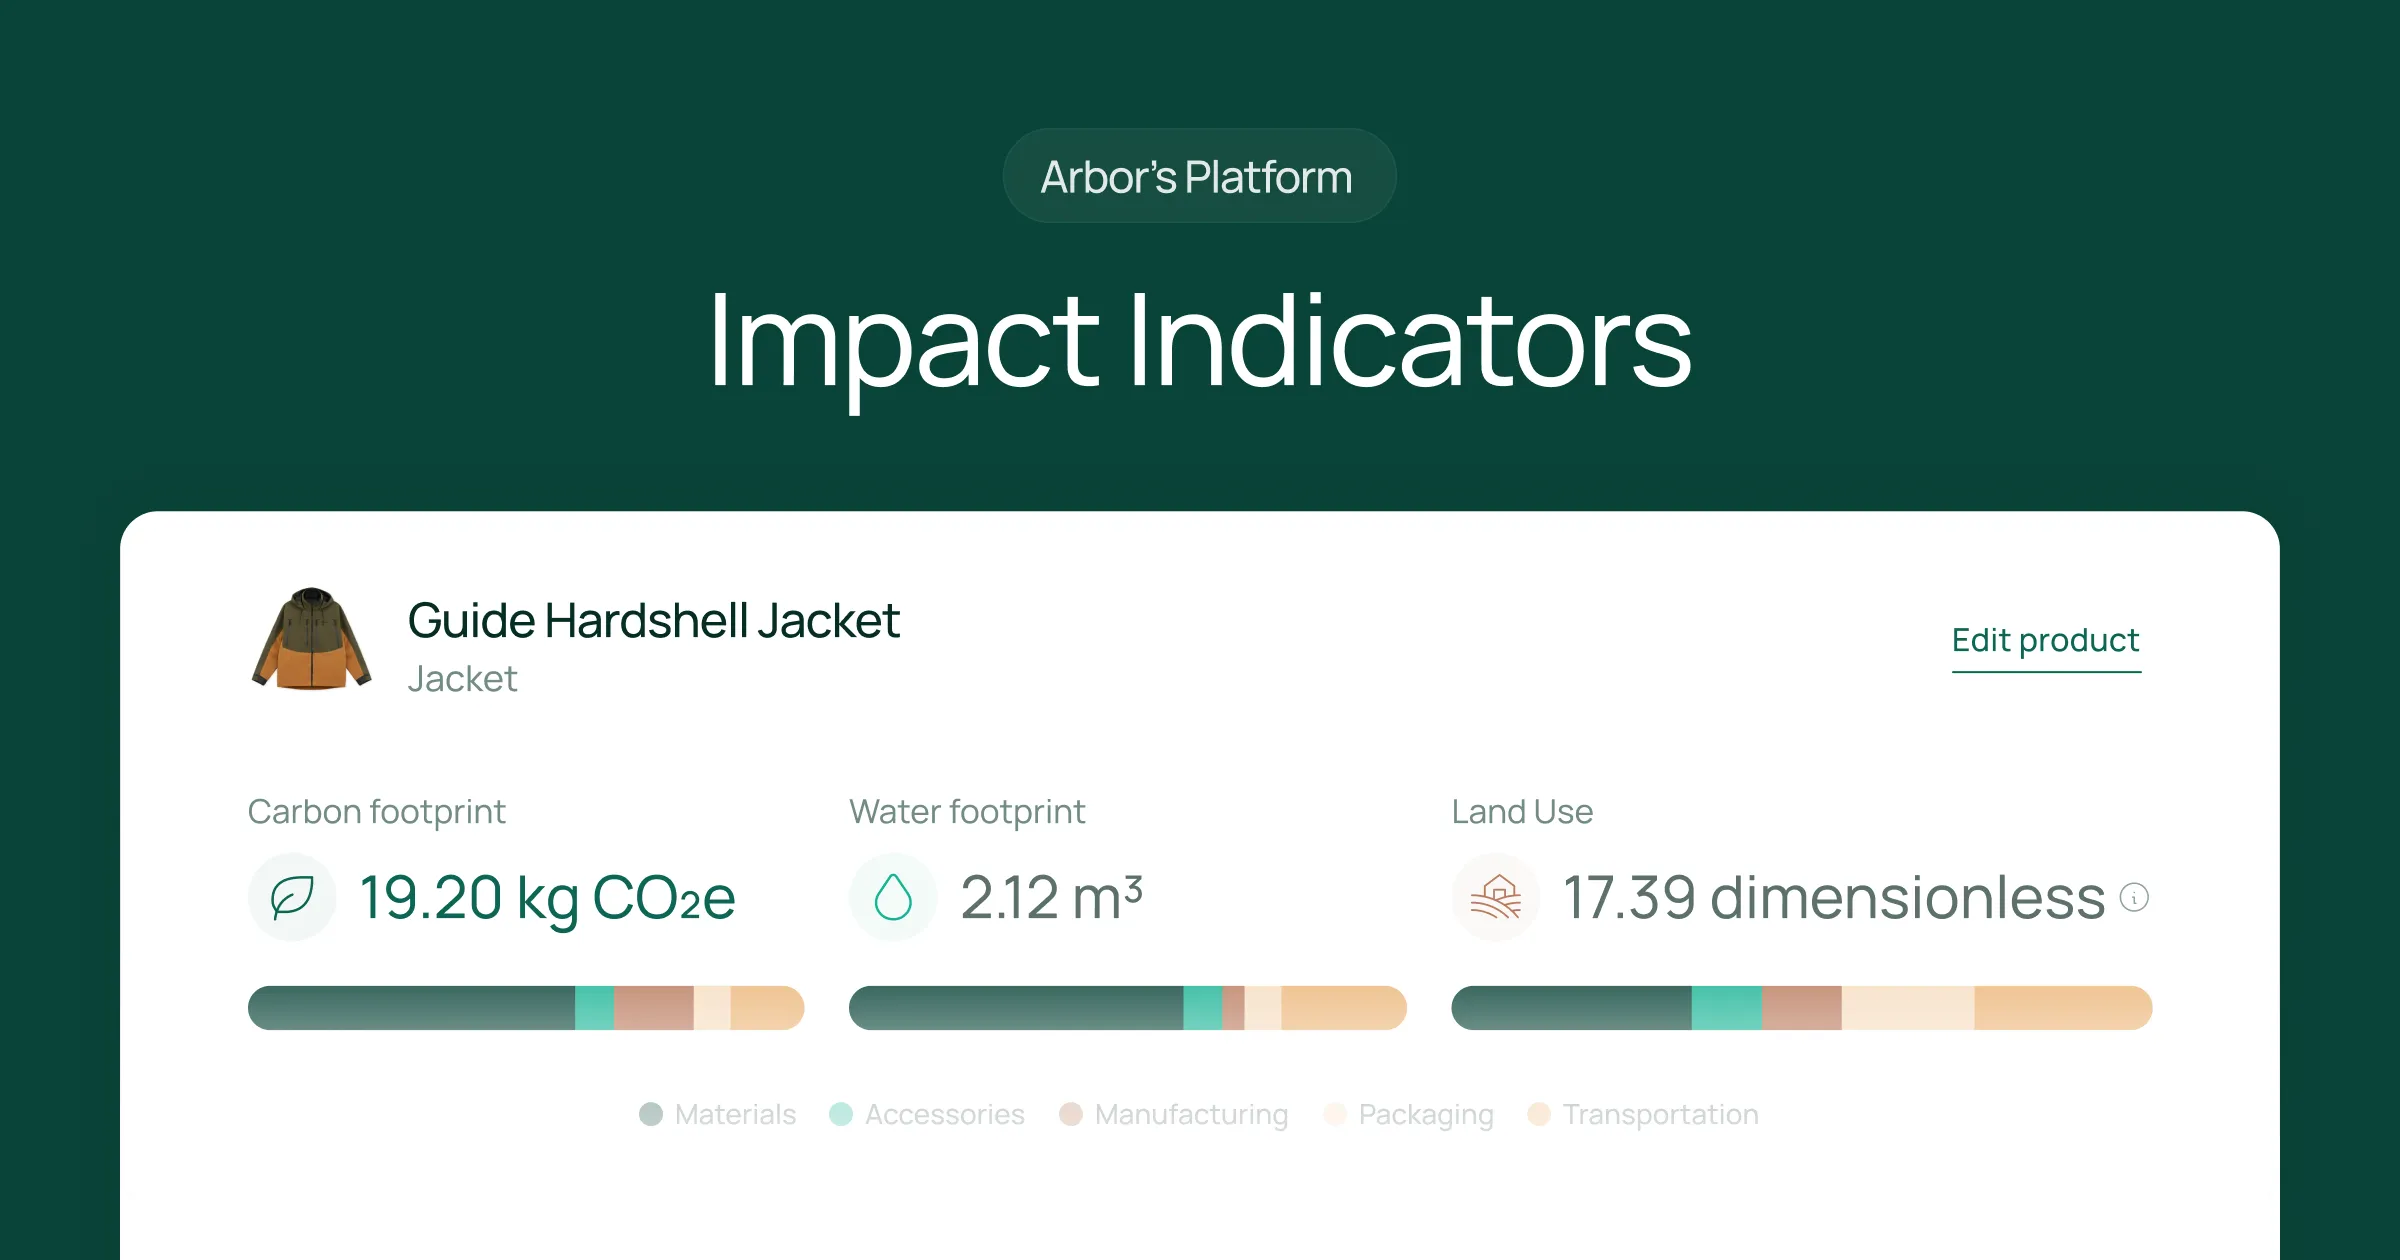
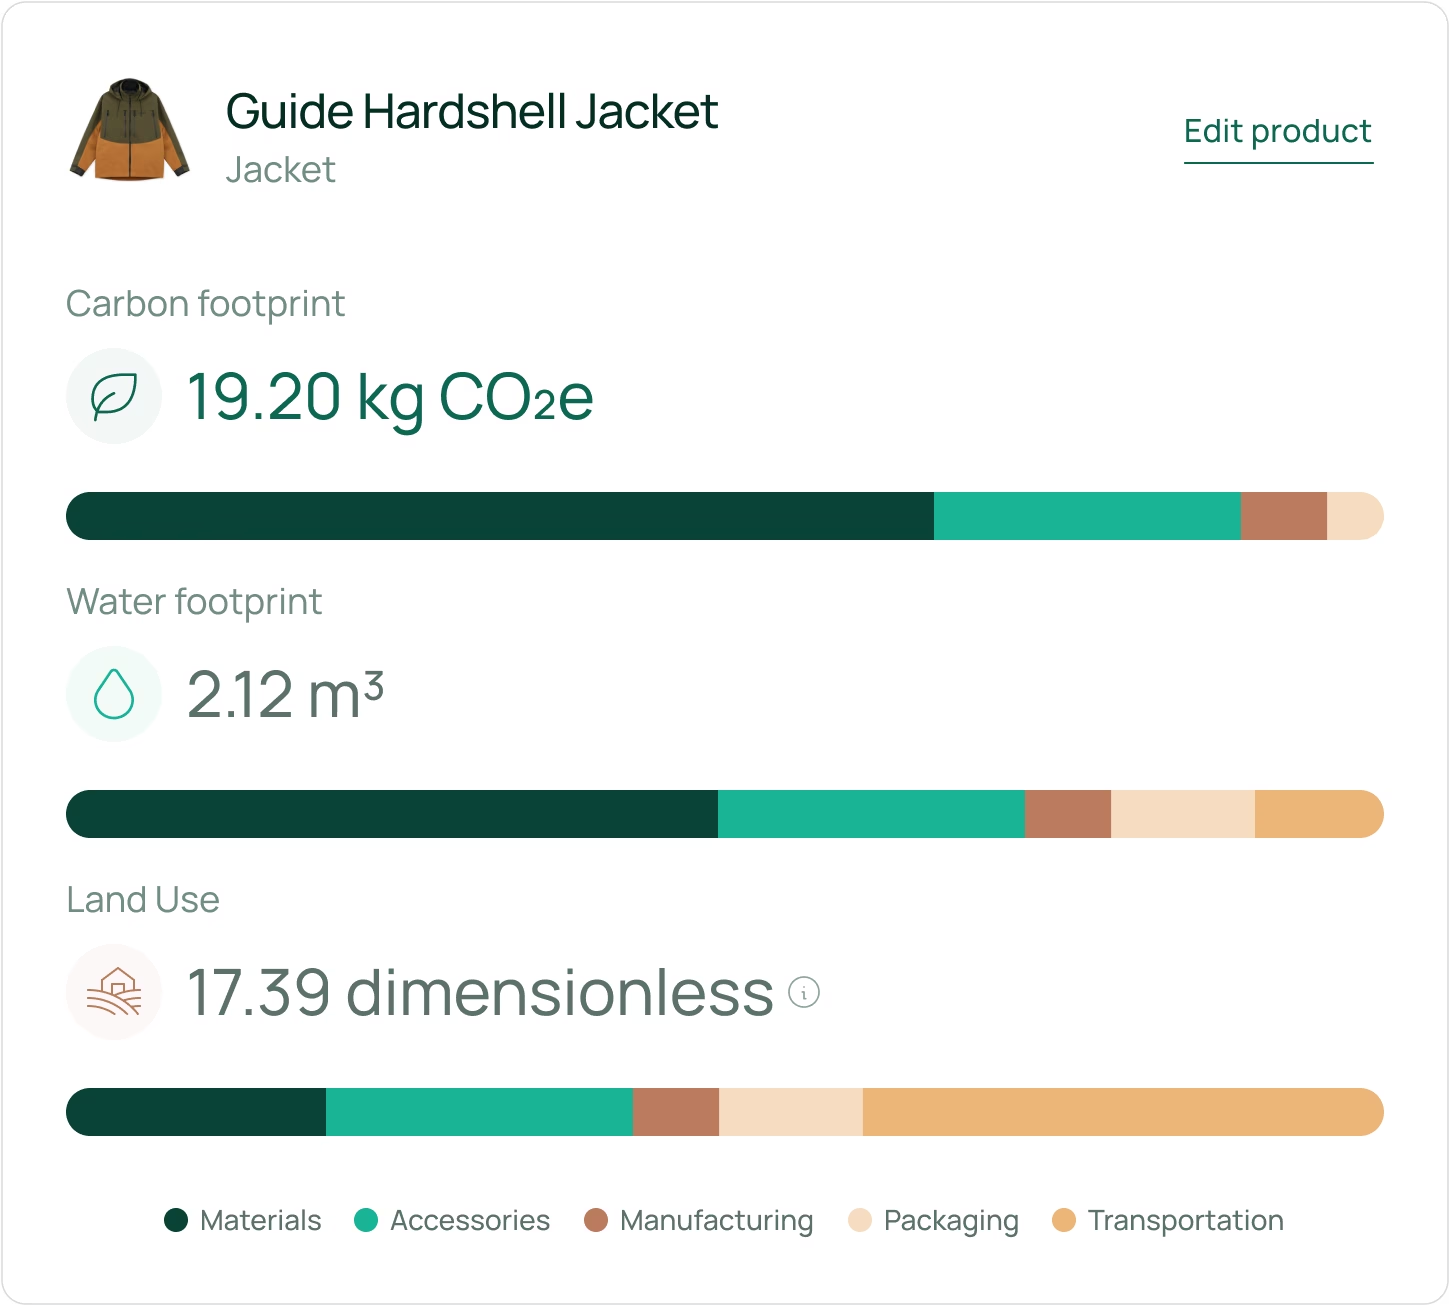
Arbor’s available impact indicators
Arbor's platform provides a comprehensive suite of environmental impact indicators based on established Life Cycle Assessment (LCA) methodologies. All indicators in the table below are available upon request to provide a complete, scientifically sound analysis of your product's total footprint.
Ready to go beyond carbon? How to get access
Arbor’s new environmental impact indicators are available now as a premium feature. If you're ready to gain a complete understanding of your product's environmental footprint, you can start today. Whether you are responding to investor scrutiny, fulfilling EPD disclosure requirements, or meeting customer demand for greater transparency, Arbor provides the tools you need.
Contact us to request access to these additional indicators and unlock a deeper level of insight into your product's lifecycle.
Measure your carbon emissions with Arbor
Simple, easy carbon accounting.
Frequently Asked Questions
What environmental impact indicators are included as standard in Arbor's platform?
By default, every product analysis on the Arbor platform includes the Global Warming Potential (GWP100), commonly known as the carbon footprint, measured in kg CO2-Eq (CO2e).
How can I access the other environmental impact indicators?
Access to any additional indicators, including Water Use and Land Use, is available by request at an additional cost. Please contact our team to discuss your specific needs and get a quote for a more comprehensive analysis.
Why should I request these additional indicators?
While carbon is a critical metric, a true understanding of your product's environmental performance requires a broader view. Requesting additional indicators helps you identify hidden risks in your supply chain (like water scarcity), avoid unintended environmental trade-offs, and make more resilient, data-driven sustainability decisions.
Can I use these indicators for EPDs and other compliance reporting?
Yes, the impact indicators available on the Arbor platform are based on standard LCA methodologies and can be used for various reporting purposes, including Environmental Product Declarations (EPDs).
What does the unit “dimensionless” for land use mean?
“Dimensionless” means the value has no physical unit like kilograms or litres. It is an index that rolls up all land occupation and transformation over the product life-cycle into a single score. Results are expressed as a soil-quality deficit that reflects the loss in soil-organic-matter quality relative to an undisturbed reference. A larger index signals a greater long-term impact on soil health, making it easy to compare products even when they use different land areas, farming methods, or time spans.

.webp)


%20Arbor.avif)
%20Arbor.avif)


.avif)

%20Arbor%20Canada.avif)
.avif)
%20Arbor.avif)
.avif)


_.avif)
.avif)
%20Arbor.avif)


%20Software%20and%20Tools.avif)


.avif)
.avif)


%20EU%20Regulation.avif)


.avif)


%20Arbor.avif)


_%20_%20Carbon%20101.avif)


.avif)

.avif)
.avif)


